Surge detection
Price bounced. Did the options flow change too?
Put SPY or QQQ price beside cumulative net call and put premium. See where they moved together, where they separated, and which part of the session deserves a closer look.
Free and Pro include the same tools. Free data is 15 minutes delayed; Pro is real-time. Seven-day Pro trial. The public scanner needs no account.
Swipe the capture to inspect it, or tap to open full-size.
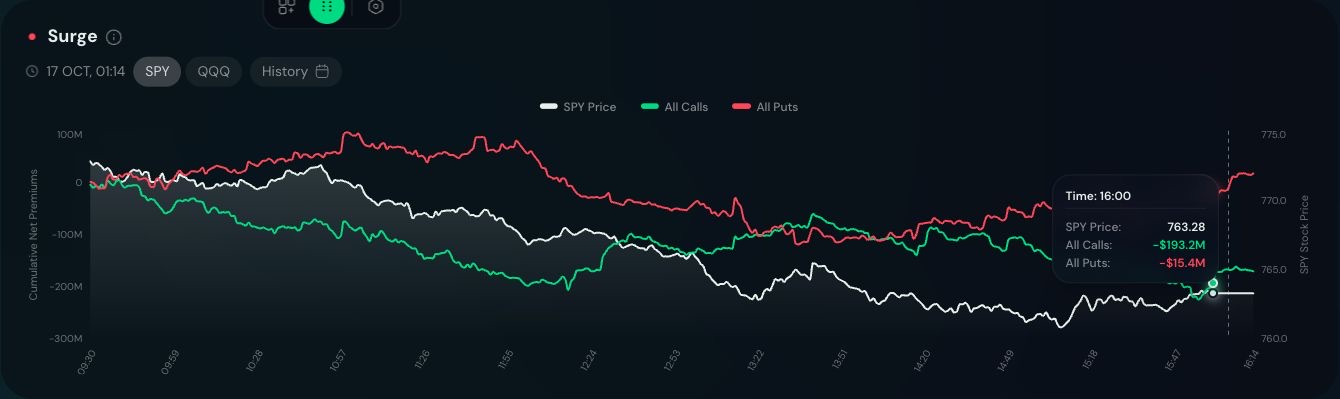
The afternoon price rebound did not erase the session’s negative net-premium readings. This is a saved chart, not a live signal.
Dashboard capture · October 16, 2026 session · selected point 16:00 ET. Open the image for full-size detail.
Read the capture · 01
Start with the same moment
At the selected 16:00 ET point, SPY reads $763.28. The white price line uses the right-hand scale.
Read the capture · 02
Read both premium lines
The tooltip shows net calls at −$193.2M and net puts at −$15.4M. Negative net premium is not negative trading volume.
Read the capture · 03
Turn the chart into a question
Which prints contributed during the rebound? Inspect that interval in Live Flow instead of assuming price and premium must agree.
Keep the example in context. Premium and price use different scales. The header’s capture time is not the selected chart time, and a hover value need not match a later summary card. This chart neither predicts direction nor establishes why price moved.
What you can investigate
Less guessing. More context to inspect.
Call and put activity together
Separate cumulative net-premium lines help you compare changes in calls and puts over the same interval, including when either series turns negative.
One timeline, two scales
Hover to read the selected timestamp, price and premium values together. Price uses its own scale, so compare timing rather than matching the heights of the lines.
A reason to inspect the tape
A change in the chart gives you an interval to investigate. Open Live Flow separately to review individual recorded prints around that time.
Your first session
A practical place to start.
Open Surge in the dashboard and select SPY or QQQ. Use the chart timestamp to compare the same moment across the lines.
- 01
Watch the slope
A change in slope marks a change in net premium over that interval. Inspect the underlying prints rather than assuming an automatic cluster classification.
- 02
Compare call against put
The same burst reads differently if the other side is bursting too. Both lines share one axis so the imbalance is visible.
- 03
Check price at the moment
Price is drawn on the same timeline. What it did around the surge is context — the conclusion stays yours.
Continue the research
Next: Live order flowQualifying options activity as it prints — ticker, strike, premium, and execution style.
Go deeper when you need to
The fields, without the mystery.
How to read the fields
- All Calls and All Puts
- These are cumulative net-premium series. They can fall or become negative; they are not gross volume or a count of buyers.
- Underlying price
- Price shares the time axis but uses a separate scale. Equal-looking slopes are not equal quantities.
- Hover readout
- Read timestamp, underlying price and both premium values together. A historical hover value can differ from a current summary card.
Connect the steps
Pick a time interval, compare changes in both premium lines, then inspect Live Flow around that interval. Compare price response without assuming the premium change caused it.
What this cannot tell you
The chart does not establish trader identity, order intent, a causal signal or a next move. A bullish/bearish label summarizes the product's reading of activity, not a guaranteed outcome.
Explore the options Learn guidesDo I need Pro to use this?
Free and Pro include the same product tools. Free market data is 15 minutes delayed; Pro market data is real-time. A seven-day Pro trial is available. An account is needed for the dashboard. The public single-ticker scanner can be used without one.
See Free and Pro plansExplore the tools with your own research question.
Free and Pro include the same product tools. Free market data is 15 minutes delayed; Pro market data is real-time. A seven-day Pro trial is available.