See the activity behind each market move.

Explore real options activity through practical, data-led walkthroughs.

Same tools on Free and Pro. Free data is 15 minutes delayed; Pro is real-time. The public scanner needs no account.

Price is only one part of the picture.

Walk through Surge
Actual product captureHistorical example · not live data
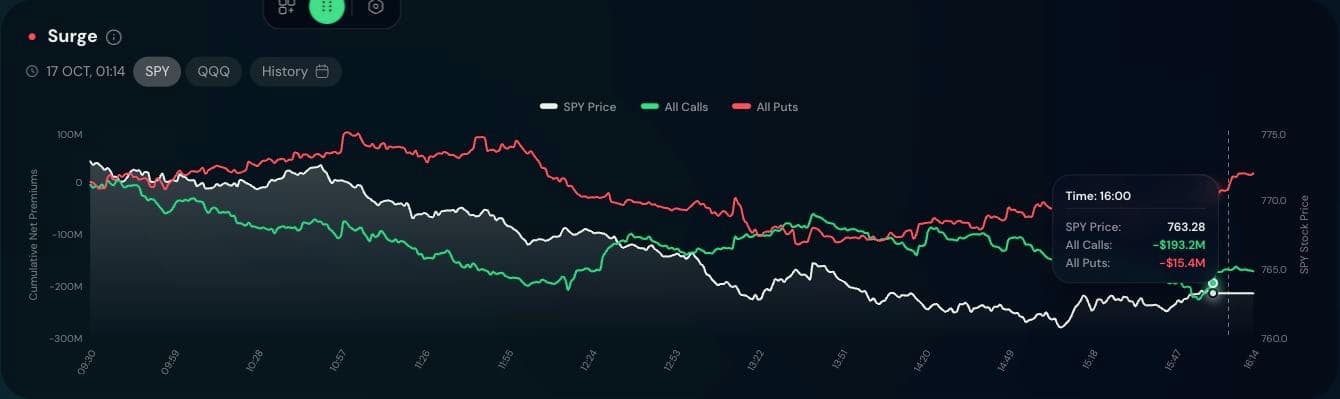
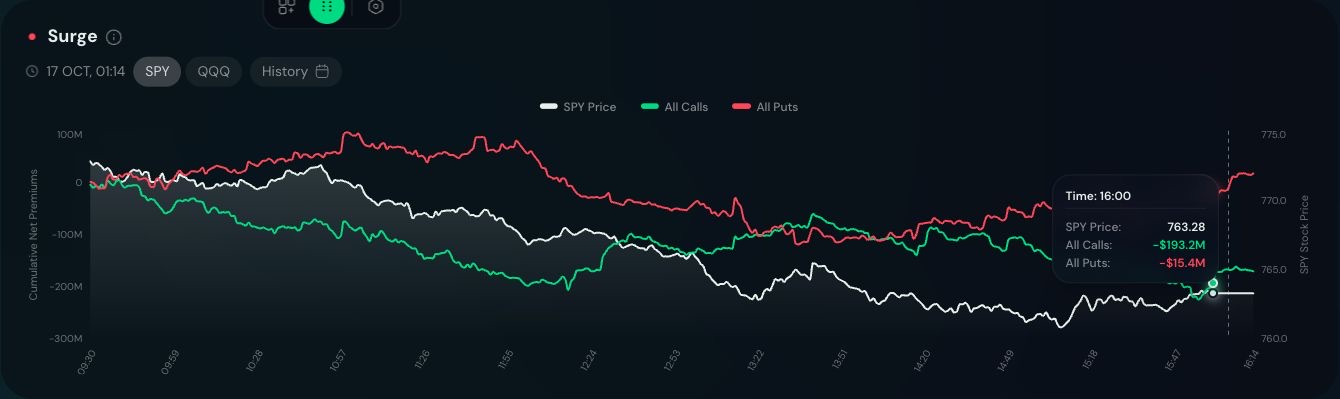
Historical Surge chart with SPY price, net call premium and net put premium; selected tooltip at 16:00 ET on October 16, 2026

Swipe the capture to inspect it, or tap to open full-size.

The afternoon price rebound did not erase the session’s negative net-premium readings. This is a saved chart, not a live signal.

Dashboard capture · October 16, 2026 session · selected point 16:00 ET. Open the image for full-size detail.

Choose your question

Six ways to investigate the market.

Live order flow

What is actually inside that large options print?

Read the contract, size, premium and execution context together. Filter the tape to the symbol you care about, then investigate the prints behind the headline number.

Historical Live Flow capture filtered to MSTR with two large call prints at 15:52:33 ET on October 16, 2026

Saved product capture · not live data

See the example & walkthrough

One-ticker scan

What traded in your ticker’s options?

Start with one symbol instead of a market-wide tape. Get its available session summary, largest prints and call-versus-put premium context before deciding whether to investigate further.

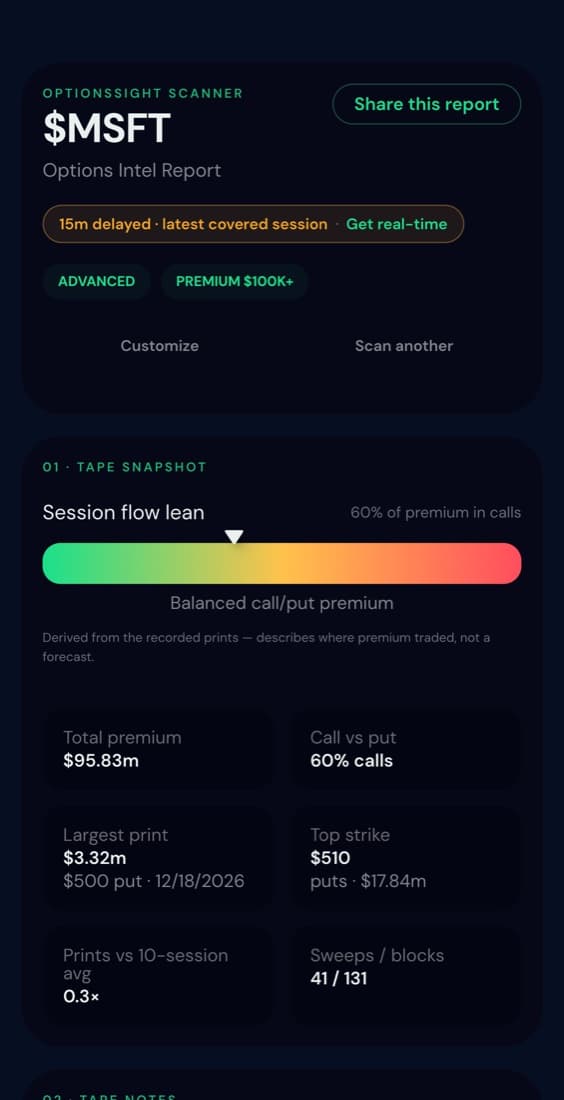
Saved MSFT scanner report showing delayed-data label, session premium split, largest print and execution mix

Saved product capture · not live data

See the example & walkthrough

Surge detection

Price bounced. Did the options flow change too?

Put SPY or QQQ price beside cumulative net call and put premium. See where they moved together, where they separated, and which part of the session deserves a closer look.

Historical Surge chart with SPY price, net call premium and net put premium; selected tooltip at 16:00 ET on October 16, 2026

Saved product capture · not live data

See the example & walkthrough

Dealer positioning

Where is modeled exposure concentrated?

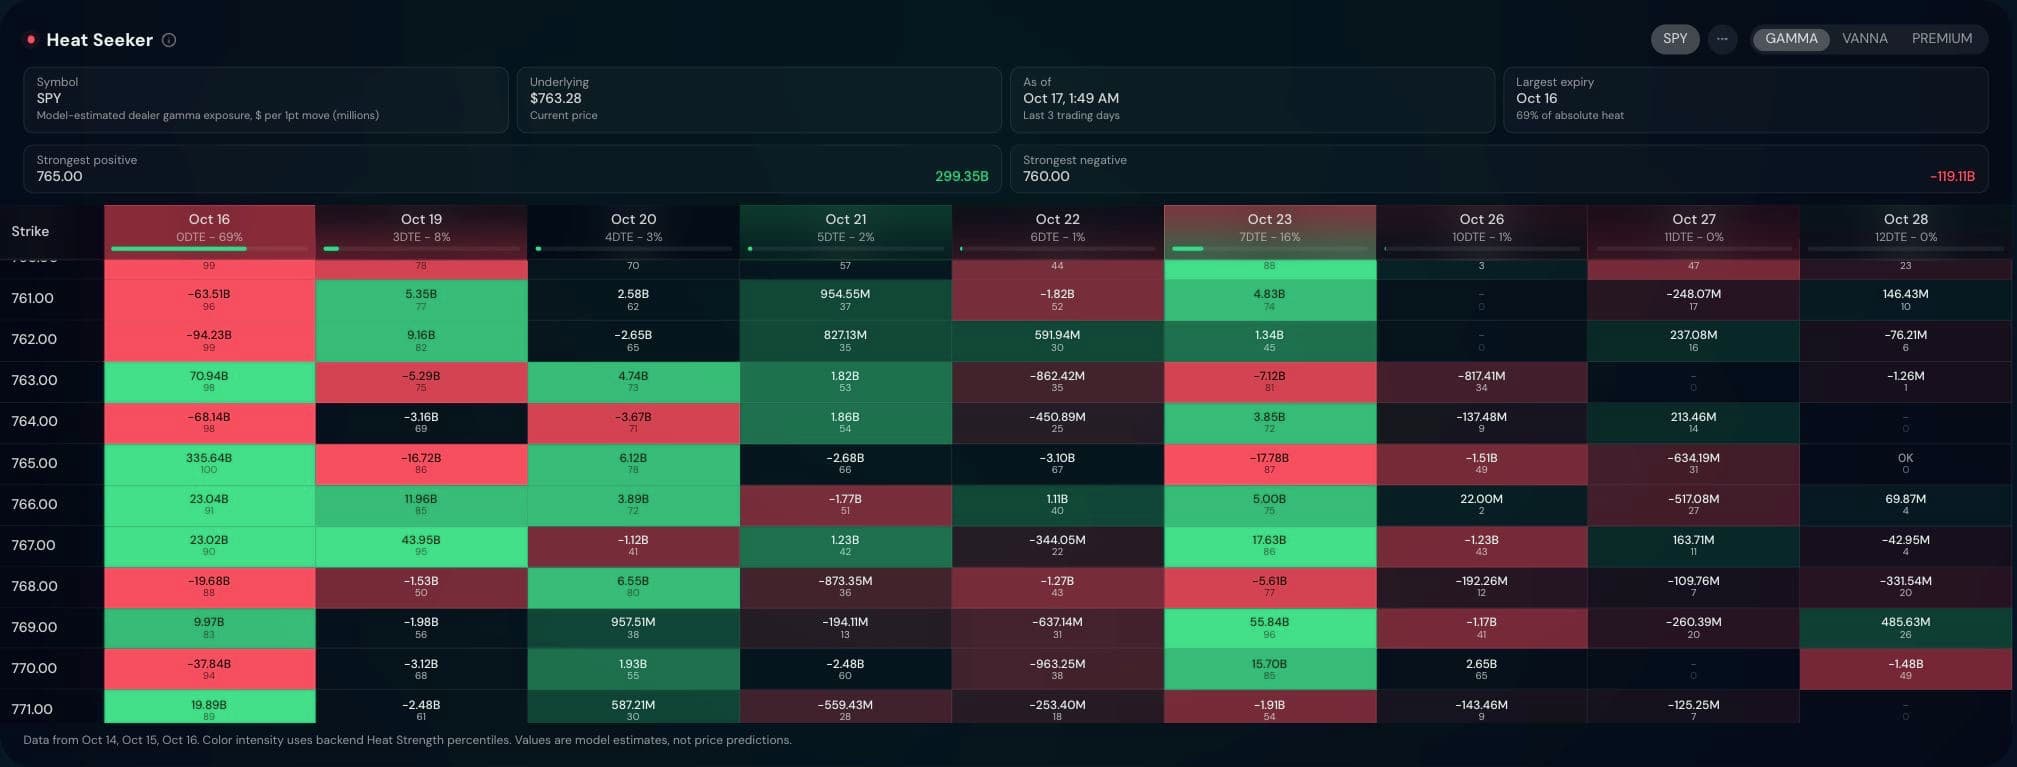
Use Gamma Exposure for a strike-level overview, then Heat Seeker for the strike-by-expiry detail. Keep model estimates separate from the trades you can actually observe.

Historical SPY Heat Seeker Gamma grid with strike rows, expiry columns, strongest levels and as-of time

Saved product capture · not live data

See the example & walkthrough

Top movers

Which names deserve a closer look in the tape?

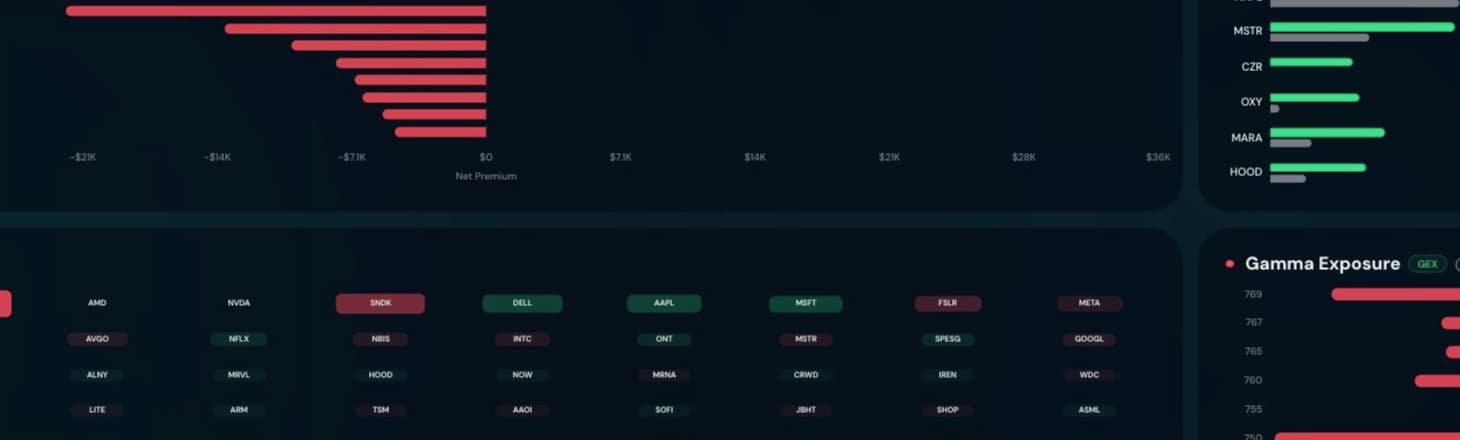
Start with a cross-market ranking of net options premium. Shortlist names, compare the signed values, then open the individual prints rather than treating a ranking as a trade idea.

Historical Top Movers net-premium chart with named tickers on both sides of zero

Saved product capture · not live data

See the example & walkthrough

Watchlist & alerts

Why are you watching this name—and what changed?

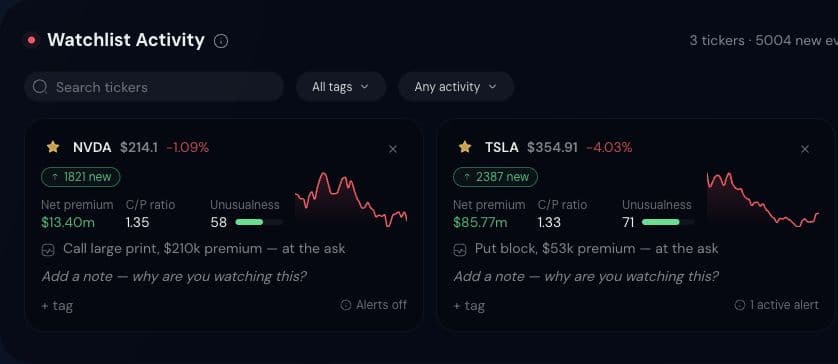
Keep selected tickers, price context, notes and tags together in My Market. Return to a focused research list instead of rebuilding your context from the whole market each session.

My Market product capture showing watched ticker cards, search and tag filters, note controls and alert status

Saved product capture · not live data

See the example & walkthrough

Inside the workspace

The rest of your research toolkit.

Go deeper into a symbol, compare activity across sectors, or connect reported headlines with the tape. Expand a tool for what it shows and how to read it.

Heat Seeker

Dashboard · Heat Seeker

Strike-by-expiry Gamma, Vanna and Premium views, strongest levels, as-of time and expiry concentration.

Modeled exposure and relative heat strength are not price targets or probabilities.

Market Pulse

Dashboard · Market Pulse

News chatter × options flow, Market News and the Live Flow tape bring reported headlines and recorded options activity into one research view.

A headline and a flow event appearing together do not prove causation. News chatter is not a measurement of social sentiment.

Ticker Lookup & Options Surfer

Dashboard · Ticker Lookup

Per-symbol options context and contract-level activity help investigate a name beyond a market-wide ranking.

Check the selected symbol, session, expiry and data timestamp; summaries are not a view of a trader's complete strategy.

Flow History

Dashboard · Flow History

Date and filter controls for researching recorded prints from available sessions.

Use the dates available in the product; historical coverage should not be assumed to be unlimited.

Premium Heat Grid

Dashboard · Flow Desk

A visual comparison of premium activity across names, alongside other desk modules.

Read whether the selected measure is gross or net before comparing it with another panel.

Volume Shift

Dashboard · Flow Desk / Surge view

Call Spike and Put Spike views compare displayed activity with its shown average; hover for the values behind a bar.

A volume spike indicates activity, not a direction forecast or proof of opening positions.

High Vol Cheaplies & LEAPs

Dashboard · Flow Desk

Contract lists with ticker, expiry, strike, call/put, premium and execution-side context.

The module names do not establish that a contract is undervalued. Check expiry, spread and liquidity independently.

Sector Sentiment

Dashboard · Flow Desk

Sector-level options premium context for comparing where recorded activity is concentrated.

Premium share is not an equity capital-flow measurement, public opinion poll or prediction.

Trade-click contract detail

Open a Live Flow row

Contract context, recorded prints and open-interest views support a closer look at a particular strike and expiry.

Open interest is not a live ledger of newly opened positions. Intraday volume can exceed it through turnover.

My Market & research workspace

Dashboard · My Market / workspace controls

Watchlists, notes, tags and workspace organization keep your research focused on relevant names.

Confirm persistence and alert delivery in your account. The workspace does not execute trades.
Before you start

Same tools. Your choice of freshness.

Free

Explore the same product tools with market data delayed by 15 minutes. Create an account for the dashboard, or try a public scan without one.

Pro

Use the tools with real-time market data. Start with a seven-day Pro trial and review the plan details before subscribing.

Compare plans

Questions

The workspace, in plain terms.

What is options order flow?

Options order flow is the stream of trades reported by the options exchanges — each print carrying its contract, size, premium and execution style. Reading flow means reviewing recorded activity rather than inferred direction.

What makes options activity unusual?

Unusual activity labels help isolate qualifying prints by their reported size, premium and execution context. Check the fields and filters behind each label. A flagged print is a research starting point, not a trade recommendation.

Is the data real-time?

Free and Pro include the same product tools. Free market data is delayed by 15 minutes; Pro provides real-time market data. The Pro trial lasts seven days.

Do I need an account to try it?

No. The single-ticker scanner runs without an account — type a ticker and get its latest session report. An account unlocks the live flow tape and platform desk modules.

What features are unlocked with an account?

Creating an account unlocks the streaming live flow tape (15-minute delayed on free, real-time on Pro) and full access to platform desk modules including dealer gamma exposure (GEX), top movers by net premium, and custom watchlists.

Start with one question. Bring your own ticker.

Free and Pro include the same product tools. Free market data is 15 minutes delayed; Pro market data is real-time. A seven-day Pro trial is available.