Unusual options activity: what it means and how to read it
Unusual options activity is a screened subset of options trading that stands out because of its premium, contract size, volume relative to previous activity, open-interest context, or execution pattern. Traders use it to decide what deserves closer review—not to infer a complete position, predict the next move, or determine what to trade.
What can make an options trade notable?
A print may deserve a closer look when it involves:
- Meaningful premium: the dollar value paid for the contracts is large enough to stand out.
- Large size: a single trade or a cluster of trades represents substantial contract activity.
- Volume in context: current-session volume is elevated relative to previous activity or prior-session open interest.
- Execution pattern: sweeps, blocks, repeated prints, or activity spread across exchanges can describe how orders reached the tape.
- Call and put premium share: the amount of premium flowing through calls versus puts gives context about the activity recorded in the tape.
No single condition proves intent. A large call print may be directional, a hedge, one leg of a spread, a closing transaction, or part of a position that is not visible in the isolated print. The tape describes recorded activity, not certainty.
There is no single exchange-defined threshold that makes a trade “unusual.” Different scanners combine premium, contract size, volume, open interest, execution, and historical context in different ways. Check the method behind the label before comparing results across tools.
Why volume and open interest need context
Options volume counts contracts traded during the current session. Open interest represents contracts that remained open after the previous clearing process. Because they measure different periods, today's volume can exceed the open interest shown during the session.
That does not prove every contract represents a newly opened position. Trades may open positions, close positions, transfer existing exposure between participants, or repeat the same contracts several times during the day. Updated open interest provides another piece of evidence after clearing, but it still does not disclose every participant's strategy.
The Options Industry Council explains that open interest rises when both sides open positions, falls when both sides close positions, and can remain unchanged when one side opens while the other closes.
Counts each contract transaction during the current session and resets for the next session.
Reflects outstanding positions after the previous clearing process, not a live count of today’s trades.
An illustrative example
Suppose a contract begins the session with open interest of 500 contracts and records volume of 1,200 contracts by midday. The elevated volume tells you that the contract is active relative to its prior open interest.
It does not tell you that 1,200 new positions were opened or that the activity is automatically bullish or bearish. The same contracts may have changed hands more than once, and the trades may belong to a hedge or multi-leg strategy. The useful conclusion is narrower: the contract deserves a closer review.
Is unusual activity the same as options flow?
No. Options flow is the broader stream of reported options trades or screened trade records. Unusual options activity is a selected subset that stands out under a chosen method. A scanner may emphasize premium, size, volume relative to open interest, repeated execution, or activity compared with a historical baseline.
That distinction matters because two scanners can review the same tape and return different lists without either list being the official definition of “unusual.” The screening rules are part of the result.
A practical way to review unusual activity
- Start with the underlying. Check current news, earnings, corporate events, price movement, and broader market conditions.
- Inspect the contract. Review strike, expiration, call or put, premium, size, volume, and available open-interest context.
- Review the execution. Note whether activity appears as a block, sweep, repeated prints, or several related contracts.
- Look for concentration. Determine whether the activity is isolated or spread across strikes, expirations, calls, and puts.
- Keep the limits visible. Treat the activity as one research input—not a recommendation, price target, or guarantee.
How Options Sight presents it
An unusual options activity scanner applies its own selection rules to reported trade data. Those rules are part of the result and should be reviewed before comparing one scanner with another.
For traders looking for a free options screener, the Options Sight Scanner lets you enter a covered ticker and review delayed unusual options activity from the latest covered market session. It ranks up to 25 recorded prints by premium and can narrow the list to premium of at least $100,000, premium of at least $50,000, or all activity. The default view adapts to the activity available for that ticker.
The report is built from qualifying Intrinio options records normalized by Options Sight. It is a screened view of the recorded activity available to the product—not a complete record of every options contract traded across the market.
The current $50,000 view is a premium filter—not a claim that each contract traded at a multiple of its own 30-day average. When sufficient session history is available, the report separately shows the ticker’s session-level options activity against its own 10-day average.
The Scanner uses delayed data for free visitors. It is designed to help you organize and review activity, not to provide investment advice.
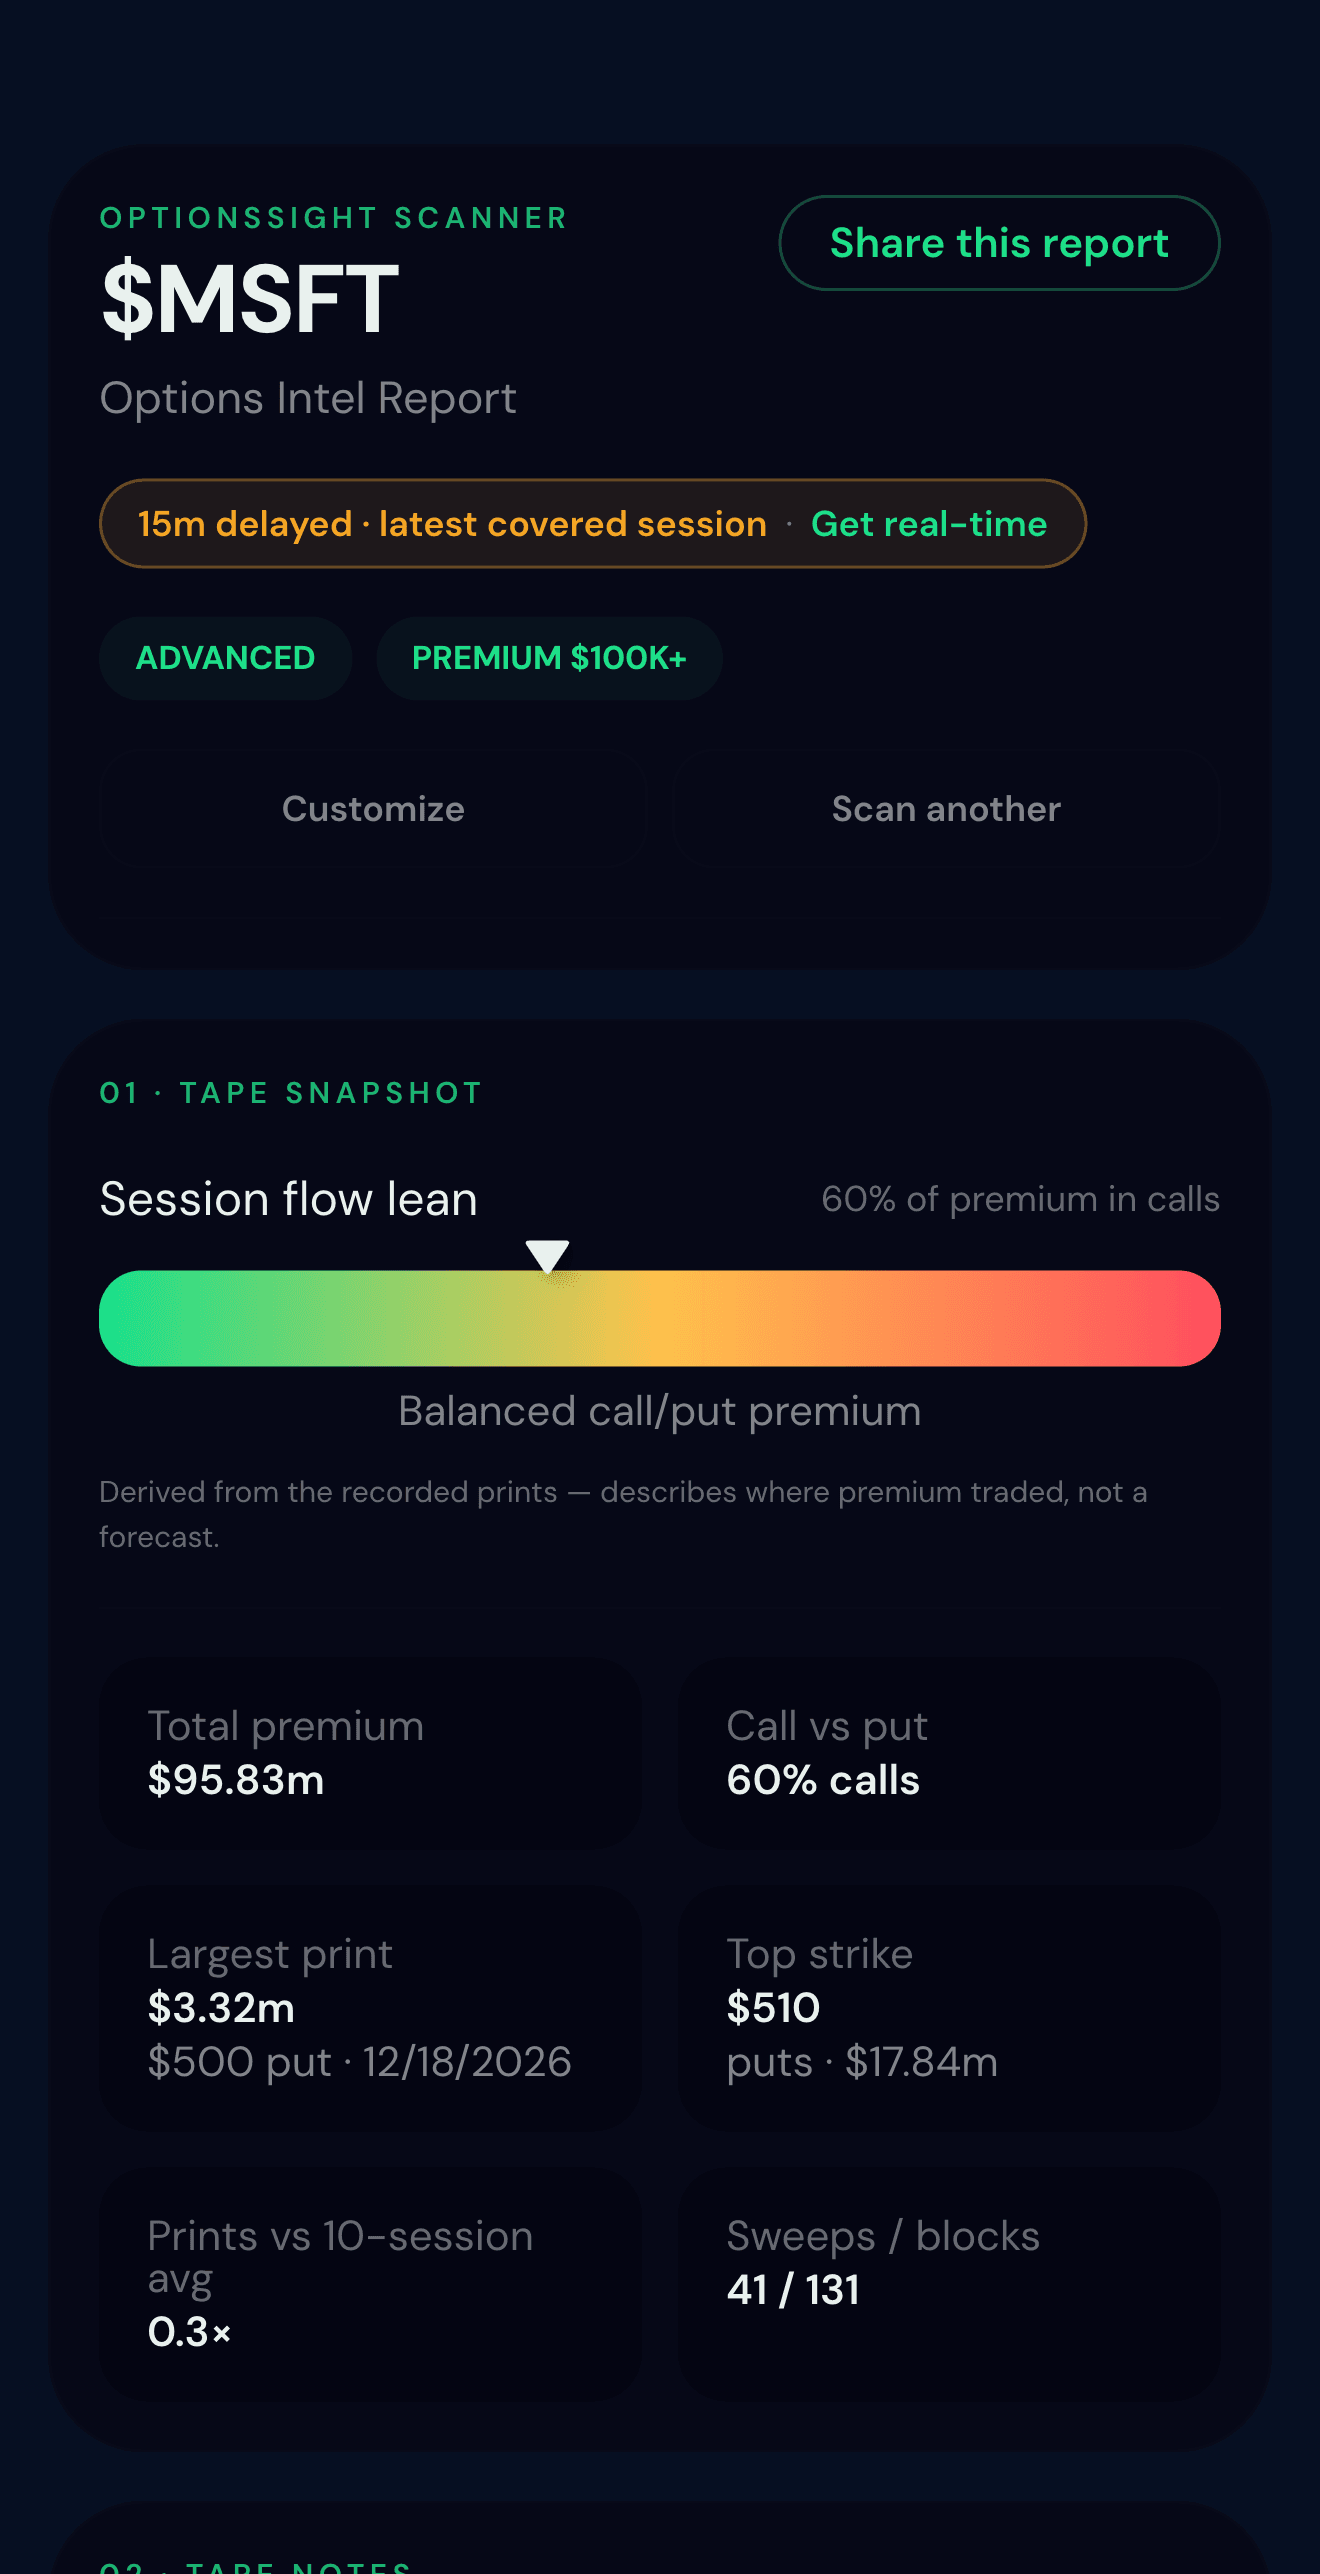
Delayed MSFT Scanner report captured from the production surface on Aug. 16, 2026 and checked against the live public report workflow on Sep. 1, 2026. It describes qualifying recorded activity for one covered session; it is not a complete market tape, sentiment score, forecast, or recommendation.
Common questions about unusual options activity
Does unusual call activity mean a stock will rise?
No. A call trade can be directional, but it can also be a hedge, a closing transaction, or one component of a more complex position. The print alone does not establish the trader's full exposure.
Does volume above open interest prove new positions are opening?
No. Volume measures contracts traded during the session, while the displayed open interest generally reflects positions remaining after the previous clearing cycle. High volume relative to open interest is a reason to investigate—not proof that every contract is new.
Does a sweep prove that someone has inside information?
No. A sweep describes an execution pattern in which an order may be filled across multiple exchanges. It can indicate urgency, but it does not disclose the trader's identity, information, complete strategy, or expected outcome.
Is there one official unusual-activity threshold?
No. “Unusual” depends on the screening method. Review the scanner’s premium, size, volume, open-interest, execution, and historical-baseline rules before interpreting or comparing its results.
Can unusual options activity predict the next price move?
No. Options activity can add context to research, but it cannot independently predict direction, timing, magnitude, or profitability.
What unusual activity cannot establish
Treat it as a prompt to investigate, then make decisions according to your own research, risk tolerance, and process.
Sources and further reading
- Open Interest: Why It Matters — Options Industry Council
- Volume and Open Interest Reports — Options Clearing Corporation
- Options: Essentials and Risks — FINRA
Options Sight is a market-intelligence and organization tool, not an investment adviser. Options involve risk. This page describes recorded market activity and does not provide financial advice.