Dealer positioning & gamma exposure (GEX): how market makers re-hedge
Dealer positioning estimates the net delta and gamma obligations of options market makers based on open interest across the options chain. Gamma exposure (GEX) measures the dollar volume of underlying shares market makers are modeled to buy or sell as spot price changes.
Whenever you buy or sell an option contract, an options market maker (dealer) is typically on the other side of the trade. Unlike directional investors, market makers do not take directional bets—they continuously hedge their exposure to remain delta-neutral.
Understanding the assumptions behind dealer-positioning models helps traders read estimated gamma concentrations and regime markers without treating them as guaranteed support, resistance, or forecasts.
Inspect a live unusual options report
See how sweeps, blocks, and cumulative net premium look on actual covered ticker data. Zero signup required for your first scan.
Why market makers hedge rather than bet
Market makers exist to provide continuous two-sided liquidity (bids and asks) on options exchanges. To make a profit from the bid-ask spread while remaining immune to directional market moves, dealers maintain a delta-neutral portfolio:
- The Initial Hedge (Delta): If a trader buys 100 call options with a 0.50 Delta, a model that assumes the dealer is short those calls represents a 50-delta short position (about 5,000 share-equivalent deltas). The actual hedge depends on the counterparties and their existing books.
- Dynamic Adjustments (Gamma): As the stock price fluctuates, the option's Delta changes. Gamma ($\Gamma$) measures how fast Delta changes per dollar move in the stock.
- Re-hedging Flow: Because Delta changes continuously, the dealer must continually buy or sell underlying shares to keep their portfolio delta-neutral.
What is Gamma Exposure (GEX)?
Gamma Exposure (GEX) aggregates the modeled gamma of every open contract across an entire options chain, strike by strike:
- Strike Concentration: Strikes with high open interest (such as monthly expiration strikes or major round numbers) create large concentrations of dealer gamma.
- Dollar Value per 1% Move: GEX quantifies how many millions of dollars worth of underlying shares market makers would need to buy or sell if the underlying stock moves by 1%.
- Near-the-Money Intensity: Gamma is highest for at-the-money options close to expiration. Near-dated expirations (like 0DTE and weekly contracts) exert disproportionate dynamic hedging pressure on intraday trading sessions.
Long gamma vs. short gamma regimes
The sign of dealer gamma exposure determines whether market maker hedging dampens or amplifies market volatility.
Dealers sell shares into market rallies and buy shares into market dips to maintain delta neutrality. This mechanical counter-trend hedging dampens market volatility.
Dealers must buy shares into market rallies and sell shares into market declines. This mechanical trend-following hedging accelerates market moves and expands price swings.
The Gamma Flip Point
The Gamma Flip Point is the price level where net dealer gamma transitions from positive (long gamma) to negative (short gamma):
- Above the Flip Point: Markets tend to trade with lower volatility, tight intraday ranges, and strong mean-reversion behavior.
- Below the Flip Point: Markets experience heightened volatility, wider intraday candles, and rapid directional moves.
Reading a dealer positioning chart
On the Options Sight platform, dealer positioning is visualized as a strike-by-strike breakdown of estimated gamma exposure:
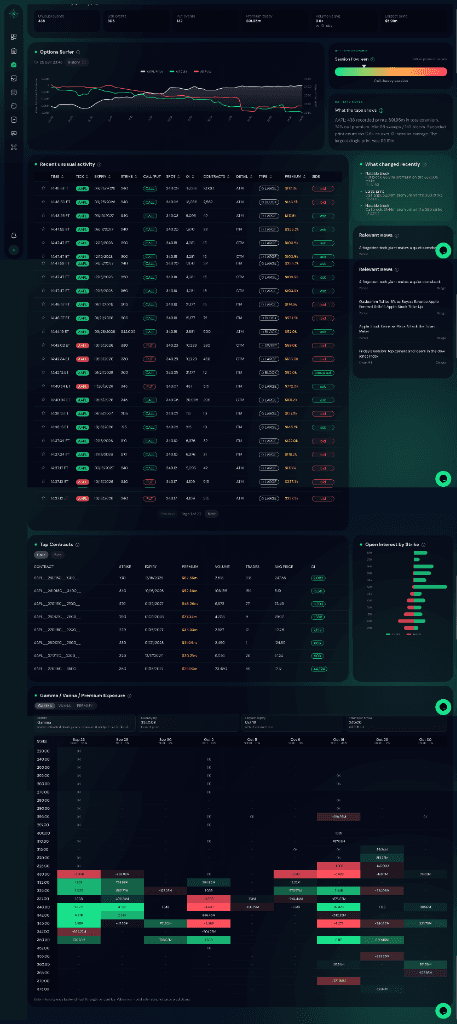
[Verified Live Evidence — Options Sight Desk] Options Sight Dealer Positioning module. Green bars represent call gamma exposure, red bars represent put gamma exposure, and the highlighted line marks the estimated gamma flip level.
Model markers to inspect on a GEX chart:
- High Call GEX Strikes: Large green bars mark strikes with high modelled call-gamma concentration. They are context for potential hedging pressure, not proven resistance or pinning.
- High Put GEX Strikes: Large red bars mark strikes with high modelled put-gamma concentration. They are context for potential hedging pressure, not a guaranteed support level or volatility floor.
- The Zero-Gamma Level: The crossover price where total call gamma equals total put gamma.
Boundaries of observation: model assumptions and limitations
Treat GEX as a structural map of potential hedging pressure—never as a guaranteed floor or ceiling that spot price cannot break.
Practical step-by-step workflow to analyze dealer positioning
Check the underlying equity
Review company announcements, earnings dates, and current price trends.
Inspect contract specifics
Note the strike price, expiration date, premium, contract count, and distance from spot price.
Analyze execution mechanics
Confirm whether the print was an intermarket sweep or block, and whether it executed at the ask or bid.
Compare volume to open interest
Evaluate whether Vol > OI, and observe whether open interest updates following overnight clearing.
Observe the boundary of the tape
Recognize that a single recorded print never establishes the participant's complete portfolio, intent, or hedge structure. Contextualize the print within broader independent market research.
Frequently asked questions
What is Gamma Exposure (GEX)?
Gamma Exposure (GEX) is a quantitative estimate of the hedging obligations of options market makers. It measures how many shares dealers must buy or sell per 1% change in the underlying stock price to remain delta-neutral.
What is the difference between positive gamma and negative gamma?
In a positive gamma (+GEX) regime, market makers re-hedge against price moves (selling rallies, buying dips), which dampens market volatility. In a negative gamma (-GEX) regime, market makers re-hedge with price moves (buying rallies, selling dips), which amplifies market volatility.
How is the Gamma Flip Point calculated?
The Gamma Flip Point is the calculated spot price where total call gamma exposure equals total put gamma exposure, representing the boundary between stabilizing (+GEX) and accelerating (-GEX) market maker hedging regimes.
Does GEX guarantee that a price level will hold as support or resistance?
No. GEX describes mechanical hedging obligations under assumed market maker positioning. Exogenous news, earnings reports, and aggressive directional order flow regularly break through modeled gamma levels.
Authoritative references and disclosures
Open Interest: Why It Matters
Daily Volume and Open Interest Reports
Options Trading Basics and Risks
Regulatory Disclosure: Options Sight is a market-intelligence and options research organization platform, not an investment adviser, broker-dealer, or financial analyst. Options trading involves substantial risk of loss and is not suitable for all investors. This educational guide describes recorded exchange data and does not provide investment or financial advice.